
A Hyperlocal Market Read for Wimberley & Dripping Springs: Beyond the Austin Metro Numbers

Beyond the Metro Headlines: A Hyperlocal Look at Wimberley & Dripping Springs — June 2026
Every month, the Austin-area market update comes along, citing months of inventory, median price, days on market - all rolled up into one number for a metro that spans dozens of wildly different communities. It's useful information in a general sense — and it's also not the whole story. June 2026 is a good example of why digging deeper matters.
I've been appraising the Austin metro since 2005 and living out here in Dripping and Wimberley since 2015, so digging into micromarkets is second nature. Between a recent Wall Street Journal piece on "us" and a Wimberley market snapshot I just put together for the Chamber of Commerce last week, it felt like the right time to pull back the curtain on what's really happening here.
A recent Wall Street Journal feature puts some helpful numbers behind the story we've been watching unfold on the ground since the pandemic. Both towns have seen substantial price appreciation since 2019 — Dripping Springs' median sale price is up over 20%, and Wimberley's is up nearly 75% — alongside a sharp rise in the share of $1 million-plus sales in both markets.
The Journal also points to a practical driver behind Dripping Springs' momentum specifically: the Highway 290 upgrade that allows commuters to drive to and from downtown Austin more quickly. For Wimberley, the piece leans into what long-time locals already know — its creeks, its arts-and-music community, its schools, and its walkable square keep pulling people in to create a life you don’t have to take a vacation from.
The Metro Number
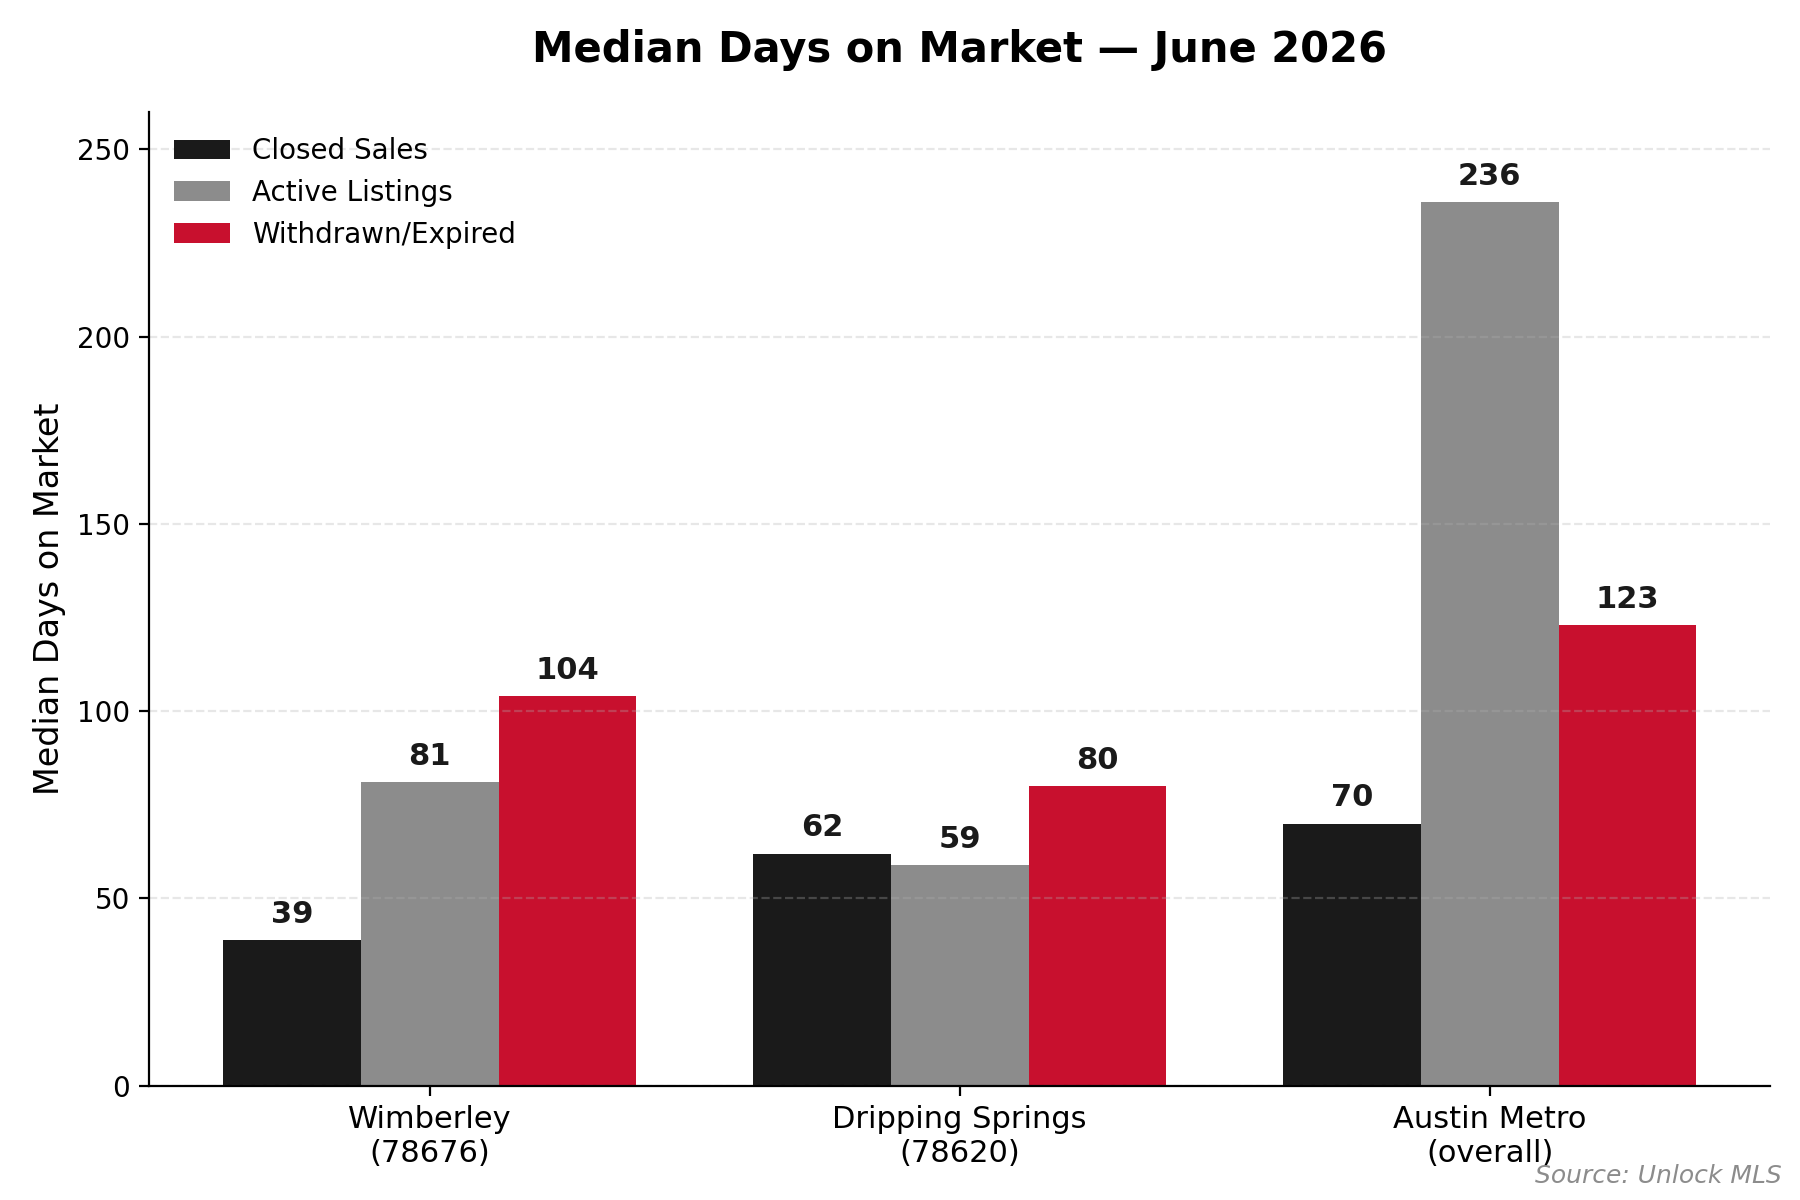
As of June 2026, the Austin metro area sits at roughly 5.9 months of inventory, with a median of 70 days on market for closed sales. Out of 2,651 active listings, the median days on market climbs to 236 — a wide spread that tells you the metro is really a blend of many different micromarkets moving at very different speeds.
So let’s take a look at how Wimberley and Dripping compare to the overall metrics:
Dripping Springs (78620)
Dripping Springs has grown considerably over the past decade, evolving into more of a modern, master-planned suburban community — which has made it an easier transition for many families moving out from the city. It still retains large swaths of classic Hill Country acreage, long-range views, and space that's increasingly hard to find closer to Austin. It's also become a hub for wellness-oriented businesses, restaurants, breweries, and distilleries, and is often referred to as the "gateway to the Hill Country." Like Wimberley, it's home to a well-regarded school district.
June 2026 MLS data for the 78620 zip code shows:
- 4.82 months of inventory
- 290 active listings
- 76 pending/under contract
- 76 closed sales
- 27 withdrawn/expired listings
- A 93% closed-to-original-list-price ratio
Here, the median DOM for closed sales was 62 days, compared to 59 days for active listings and 80 days for withdrawn/expired listings — a tighter spread than Wimberley's, consistent with its lower months-of-inventory reading.
Wimberley (78676)
Wimberley isn't trying to be Austin, and that's the point. It's a smaller, more remote community with a genuine village feel — a walkable downtown of boutiques and locally owned restaurants, a slower pace, and a strong sense of small-town identity, all backed by a well-regarded school district.
June 2026 MLS data for the 78676 zip code shows:
- 13.25 months of inventory
- 245 active listings
- 20 pending/under contract
- 20 closed sales
- 24 withdrawn/expired listings
- A 90% closed-to-original-list-price ratio
On the surface, 13+ months of inventory sounds slow. But days-on-market tells a more nuanced story: the median DOM for closed sales in June was just 39 days, while the median DOM for active listings sitting on the market is 81 days, and for withdrawn/expired listings it's 104 days.
What the Days-on-Market Gap Is Telling Us
Line up all three markets side by side and a pattern emerges: in both Wimberley and Dripping Springs, the inventory that's well-priced and shows well is moving well inside the metro's 70-day closed-sale median — and far ahead of the metro's 236-day median for what's still sitting active. The properties that linger into withdrawn/expired territory in both towns are the ones that didn't get priced or positioned correctly out of the gate.
In short: buyers in both micromarkets are moving relatively quickly on the inventory that's super desirable and priced to the current market. The properties dragging down the broader averages are largely the ones that missed the mark on pricing or presentation — not a sign of broad buyer hesitation.
Final Takeaway
Generalized market statistics — whether it's the Austin metro number or even a single zip code's average — don't capture the nuances of the micromarkets within them. A 13-month inventory read in Wimberley and a 39-day closed DOM in the same zip code aren't contradictory; they're describing two different slices of the same market. The same is true in Dripping Springs, and it's true street-by-street in neighborhoods across both communities.
That's where a professional assessment of your specific property, in its specific micromarket, matters more than any headline number. If you're weighing a sale, a purchase, or just want an honest read on where your property sits in this market, we're happy to help.
Nate & Jill Powell
Engel & Völkers Integrative Real Estate Group
+1 512.680.1606 (Nate) | +1 512.294.1320 (Jill)
jill.powell@evrealestate.com | nate.powell@evrealestate.com
www.integrativerealestategroup.com
Global Real Estate Advisor TX 832531-SA, Licensed Residential Appraiser TX 1350727-LR
Global Real Estate Advisor TX 754678-SA, Certified Residential Appraiser TX 1337048-CR, TRRS

Categories
Recent Posts



Advisor, REALTOR®, TRRS, Certified Residential Appraiser License ID: 754678
+1(512) 294-1320 | jill.powell@engelvoelkers.com